
TradingRage newsletter #5
Weekly technical, on-chain and sentiment analysis on Bitcoin

Introduction
Hi, my name is Edris. I’m a Bitcoin on-chain and sentiment analyst, working as a specialist and verified author at CryptoQuant. I’m going to share my views on the Bitcoin market using different analytical tools on a weekly basis.
Remember: I am not a financial advisor and this content is for informational and educational purposes only.
Technical analysis
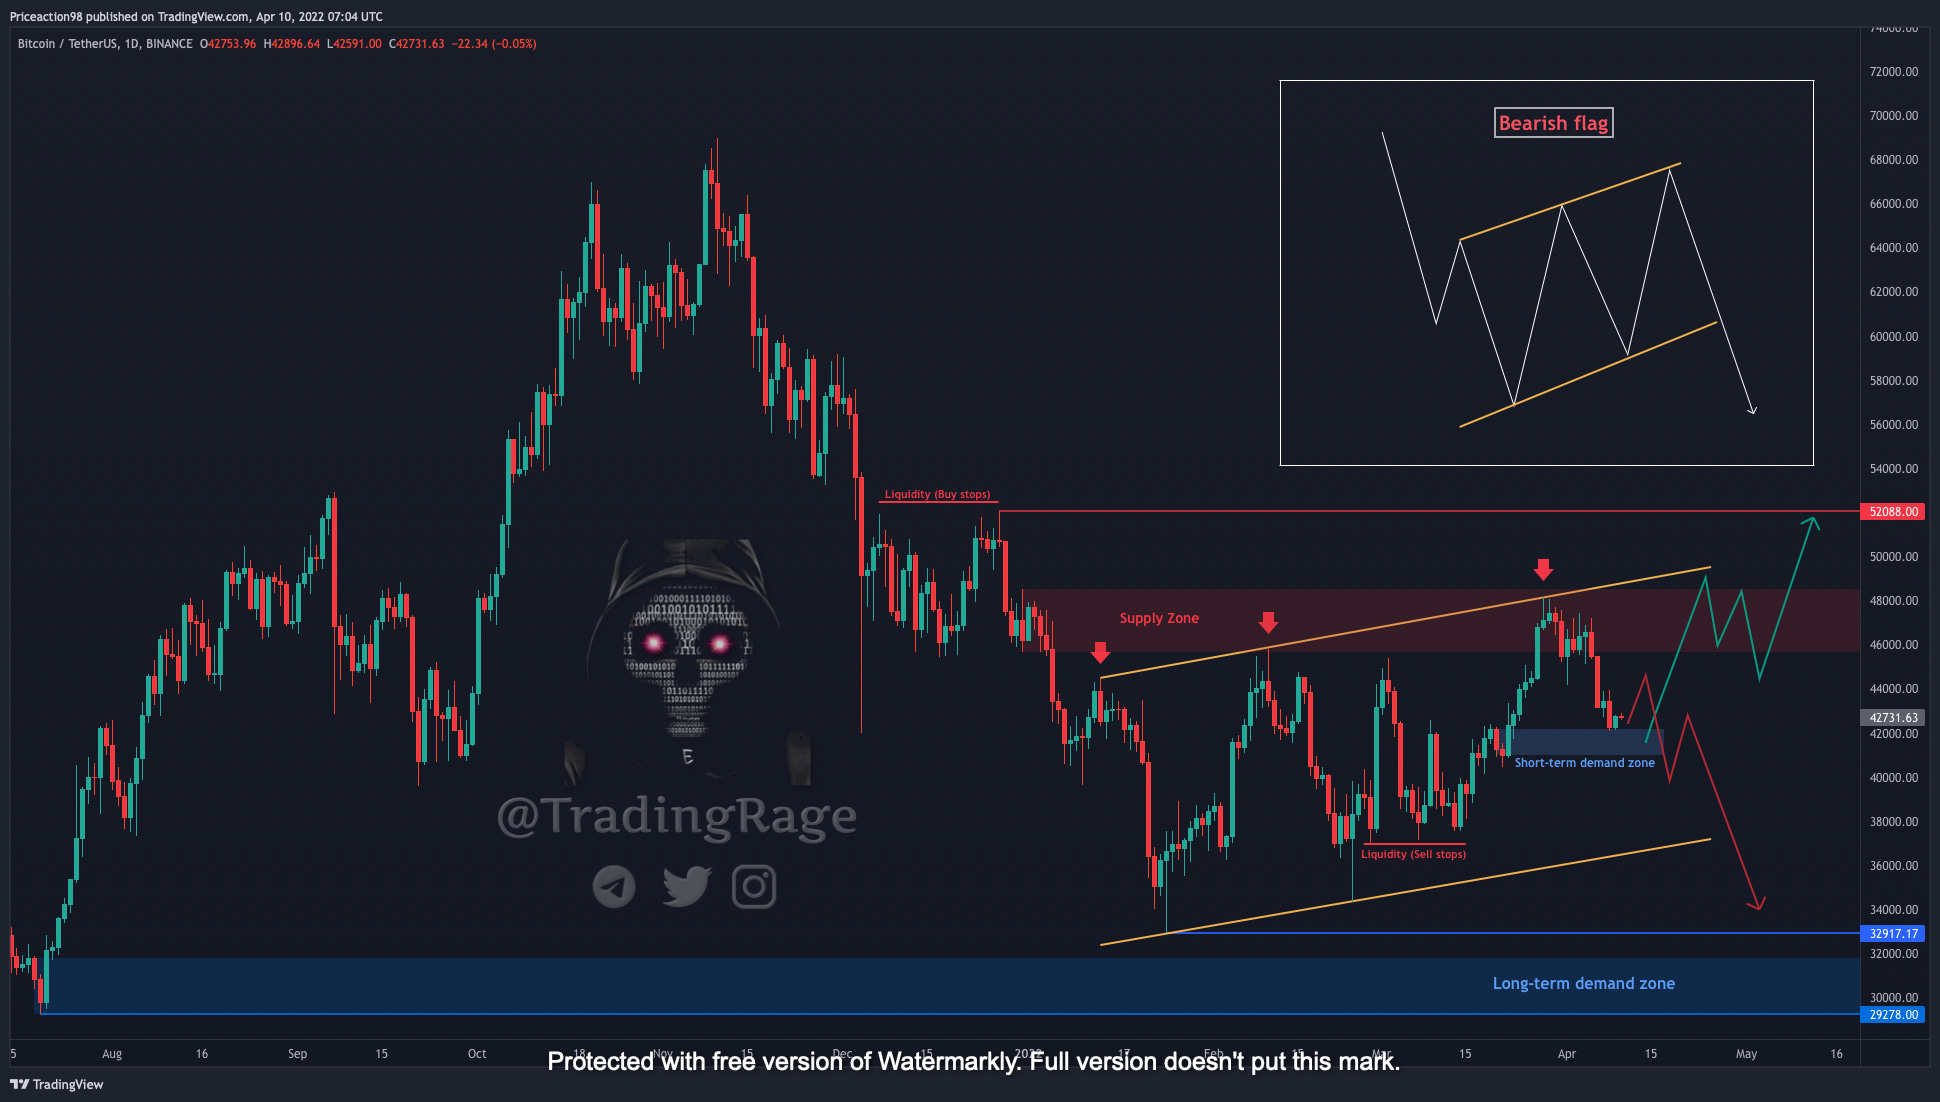
Bitcoin’s price has been rejected for the third time from the large bearish flag forming on the chart. The price has currently reached a short-term demand zone at $42 and two scenarios are possible. The first one is a bullish reversal from this area towards the top of the flag, which would probably be broken to the upside this time and the price could target the buy-side liquidity residing above $52K level. The second scenario which is the most likely one, is a failure of the $42K demand zone which would cause the price to drop to $36K and take out the sell-side liquidity below this level and continue lower to confirm the bearish flag continuation. In this case, the price would probably drop lower than the $33K low and reach the long-term demand zone around $30K. This zone could initiate a bullish reversal to the upside, but the price action should be closely analyzed on the lower timeframes to determine if this level could hold.
On-chain analysis
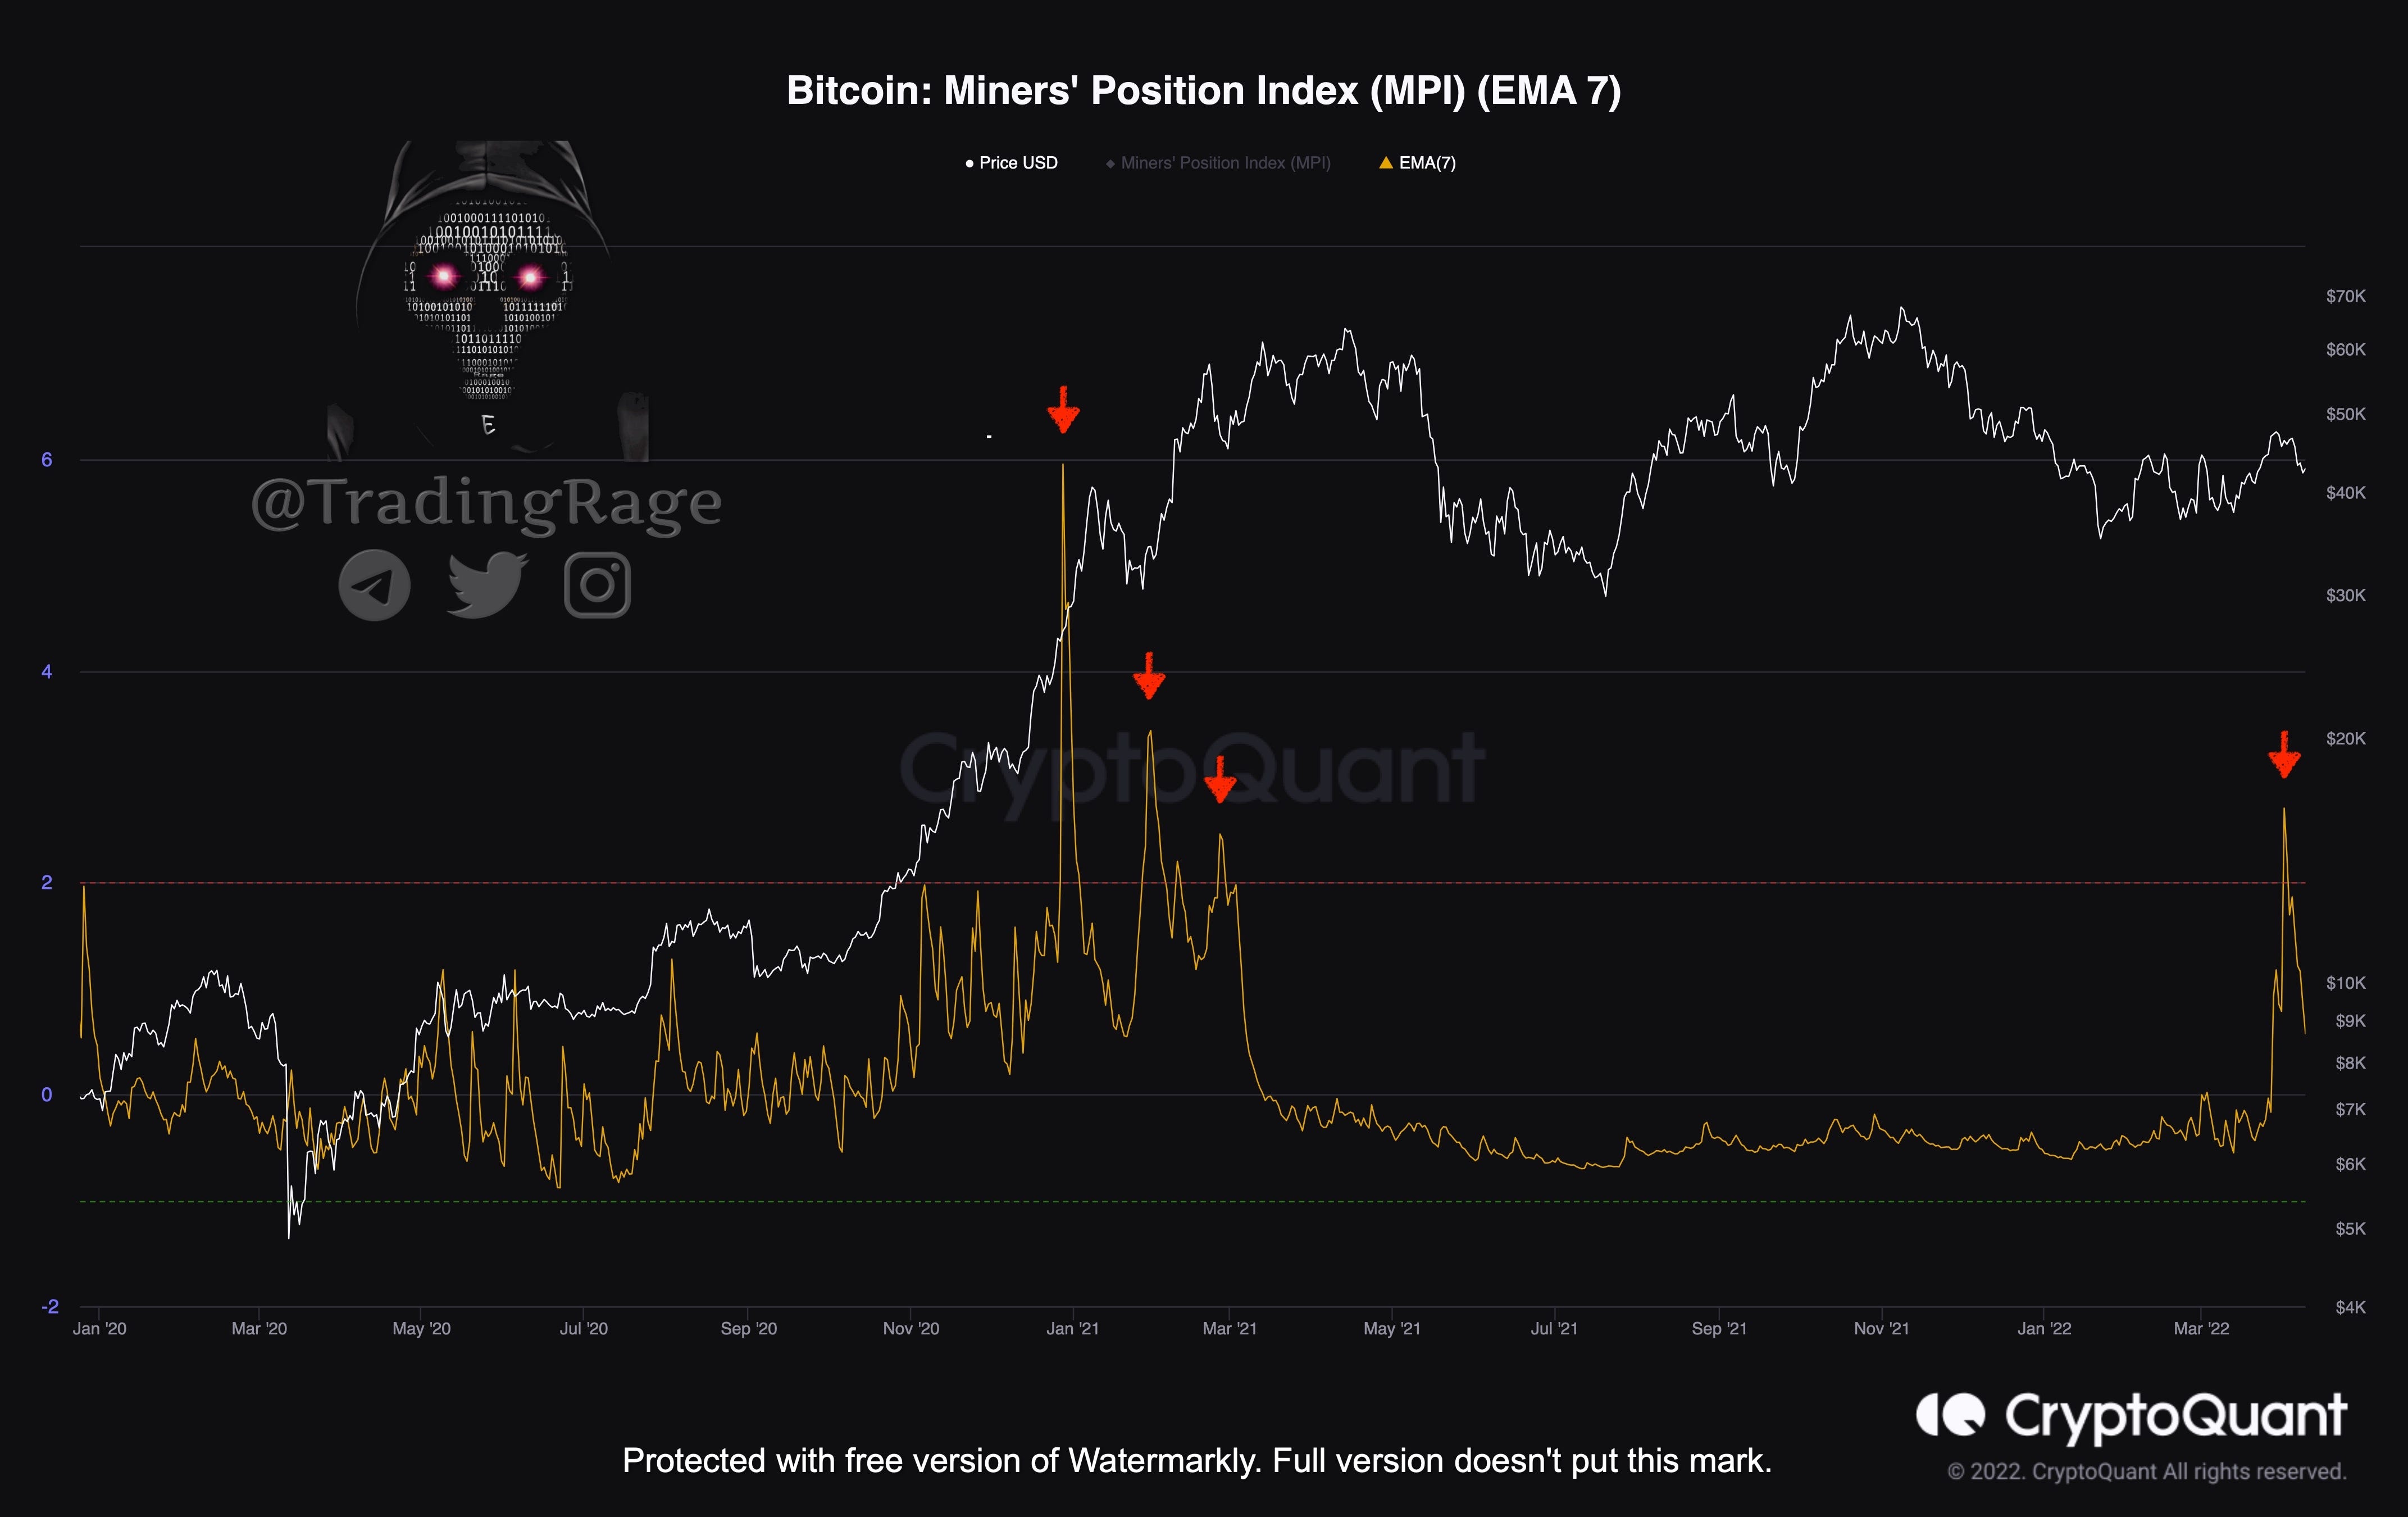
The Miner’s Position Index or MPI, is one of the most useful metrics to evaluate Bitcoin miners’ behavior and sentiment. In the past few days, the MPI metric has shown a massive peak which indicates that miners are selling a portion of their holdings and taking profits following a price rally to $48K. This kind of behavior have also been observed three times in early 2021, during the bull market. Miner’s selling pressure usually end bull markets or aggravate bearish trends. This is certainly a bearish signal and points out that the miners consider these prices suitable for profit taking or they are starting to capitulate and are losing faith in higher prices and a bullrun in the mid-term.
Futures Market Sentiment analysis
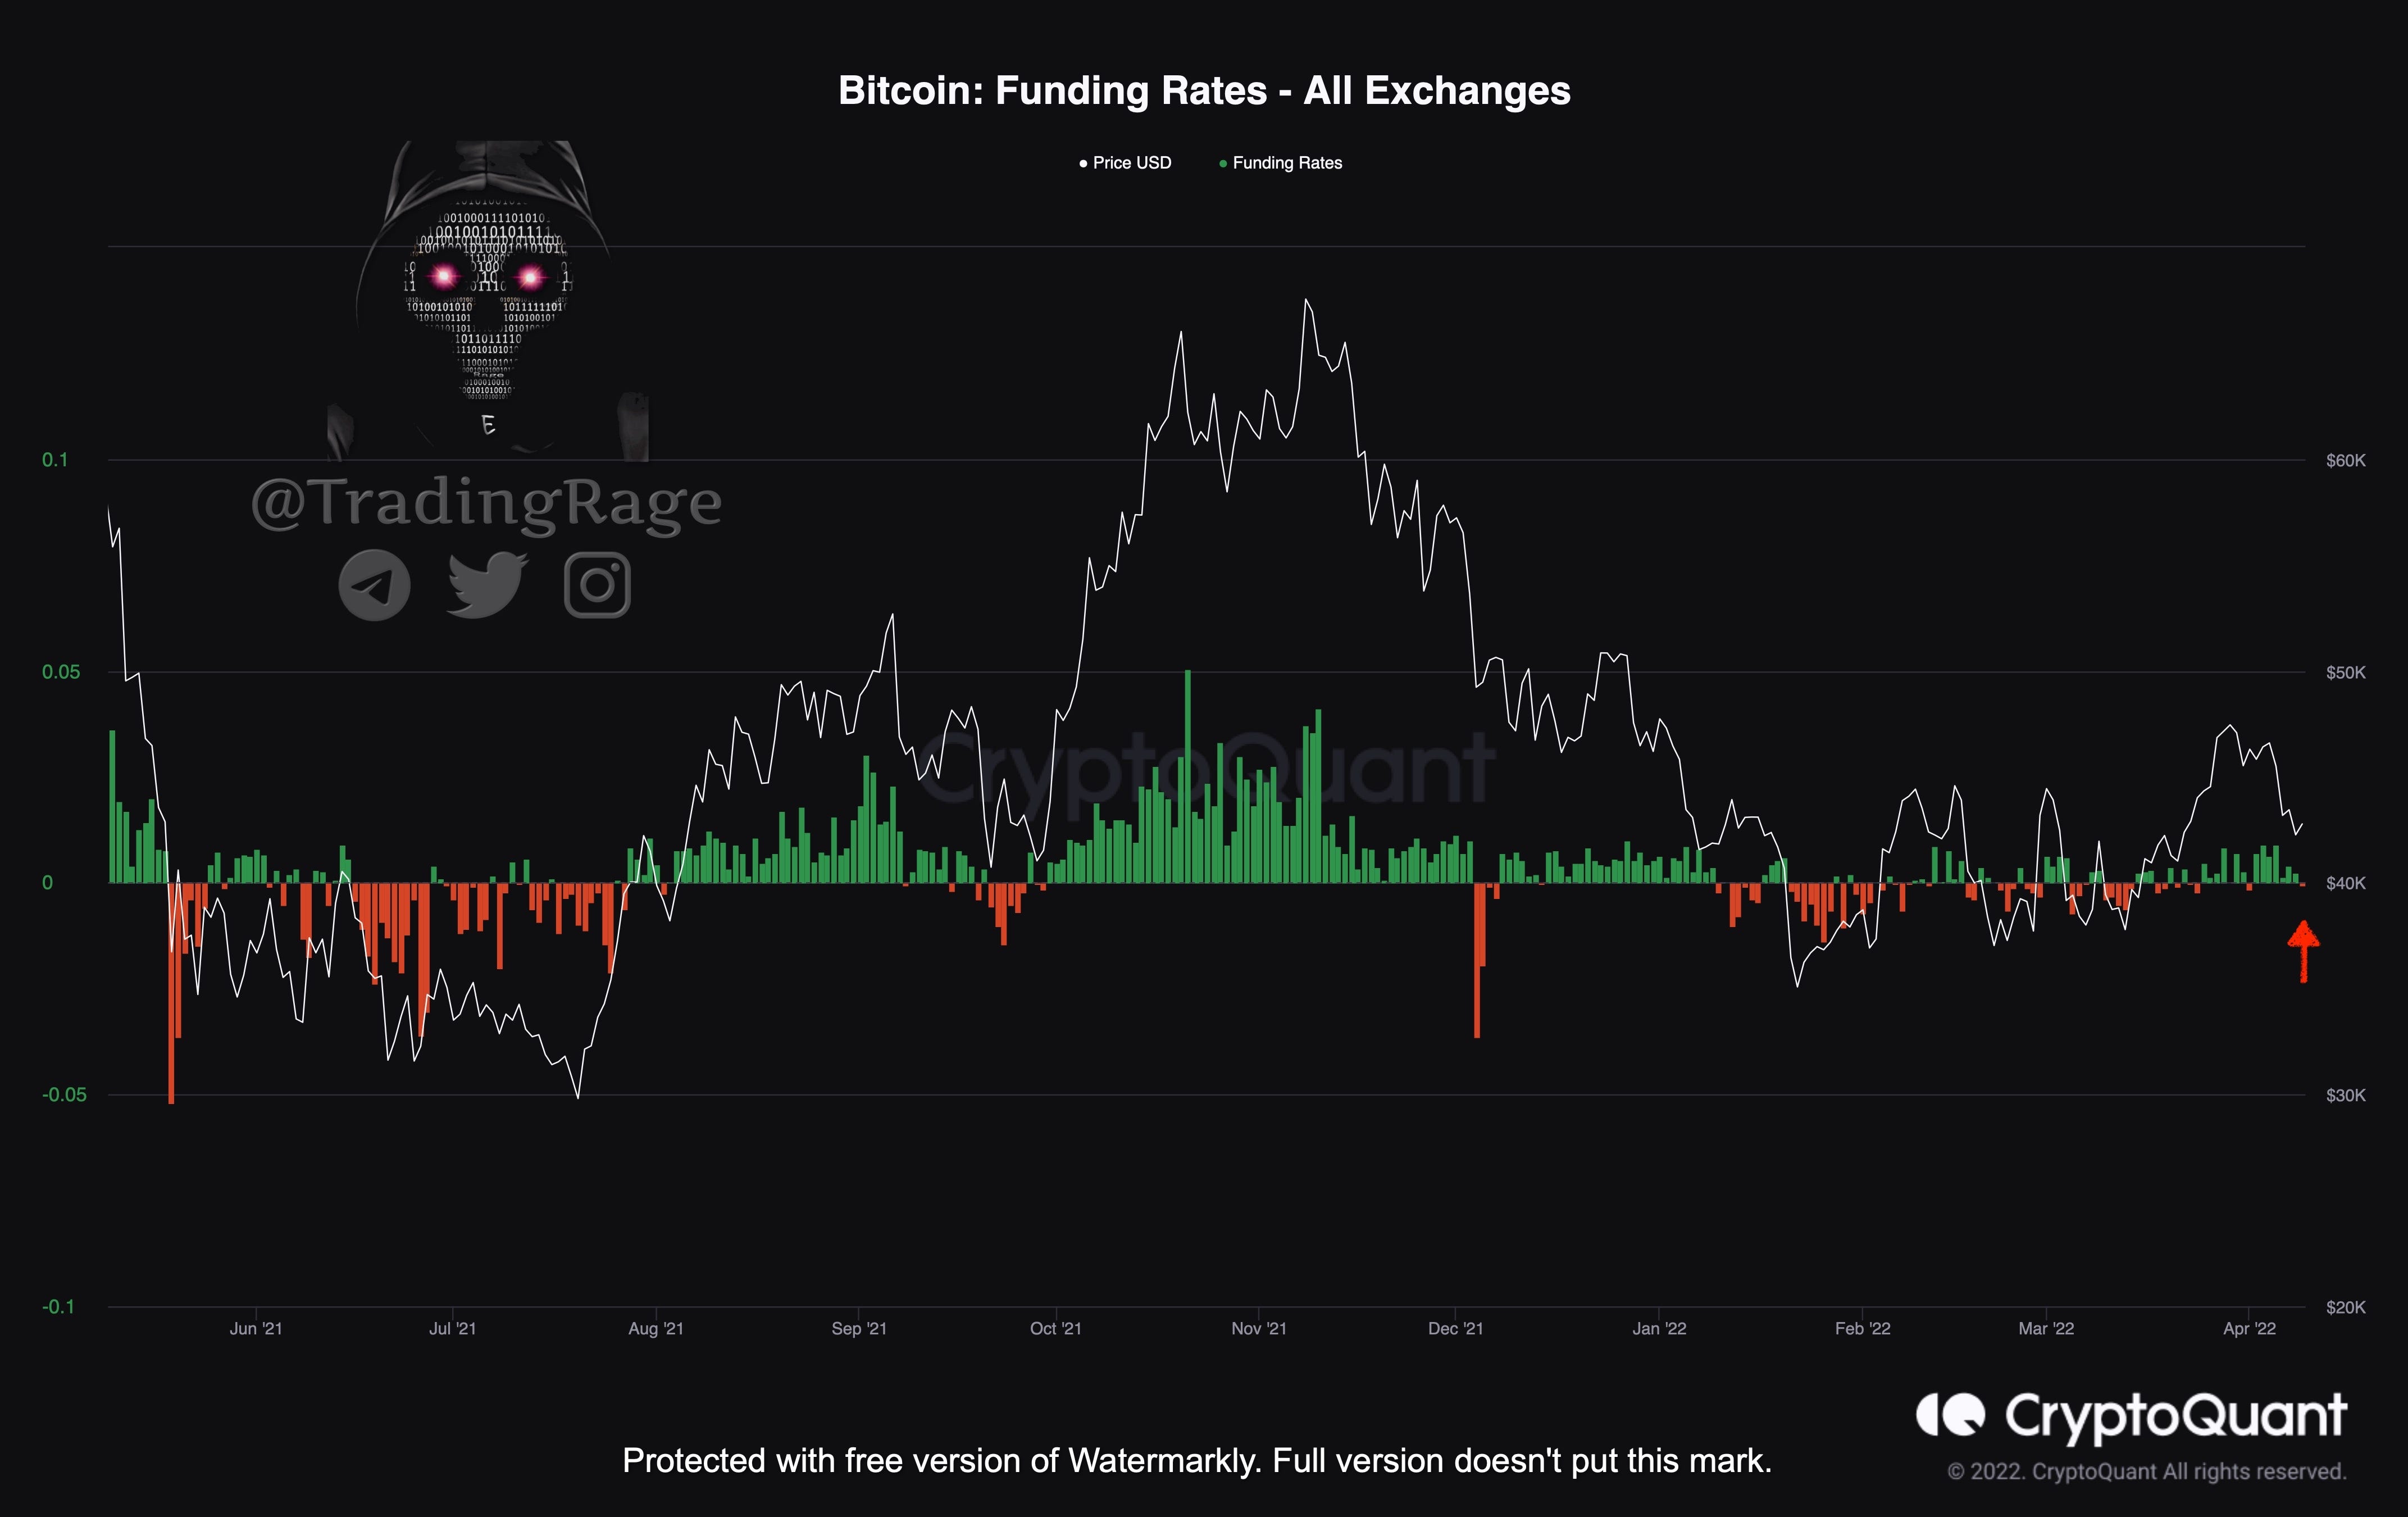
Funding rates are one of the most popular indicators for analyzing the Perpetual Futures Market sentiment. This metric has been showing positive values for the past couple of weeks as the bears were being liquidated during the rally to $48K. These positive values indicated bullish sentiment among the futures market traders and the bulls’ dominance over the market. However, following the recent drop in price, the funding rates have shown negative values again after a while. The aggressive bulls are being liquidated and the bears are coming back. This bearish sentiment could be the start of a second round of capitulation in the futures market and could lead to the price making lower lows, if the spot market is not able to cope with the selling pressure from the derivatives market.
Thank you for reading the TradingRage newsletter. I hope you have gained value from this content. It would be appreciated if you share it with your friends. You can also subscribe so that you never miss the next updates.
We shouldn't understimate the retail investors' part in this market, a lot of new investors has entered the market and although bearish scenario is more possible than the others,i personaly don't believe that the crash would be as hard as 2018 or corona crash
By the way thank you 🙏🏾
Thank you very much